File:Reconstruction plot.png: Difference between revisions
Jump to navigation
Jump to search
Molokaicat (talk | contribs) No edit summary |
Molokaicat (talk | contribs) No edit summary |
||
| Line 1: | Line 1: | ||
The left plot is the reconstruction | The left plot is the reconstruction. The right plot is the original signal. | ||
Latest revision as of 22:43, 20 December 2021
The left plot is the reconstruction. The right plot is the original signal.
File history
Click on a date/time to view the file as it appeared at that time.
| Date/Time | Thumbnail | Dimensions | User | Comment | |
|---|---|---|---|---|---|
| current | 09:43, 20 December 2021 | 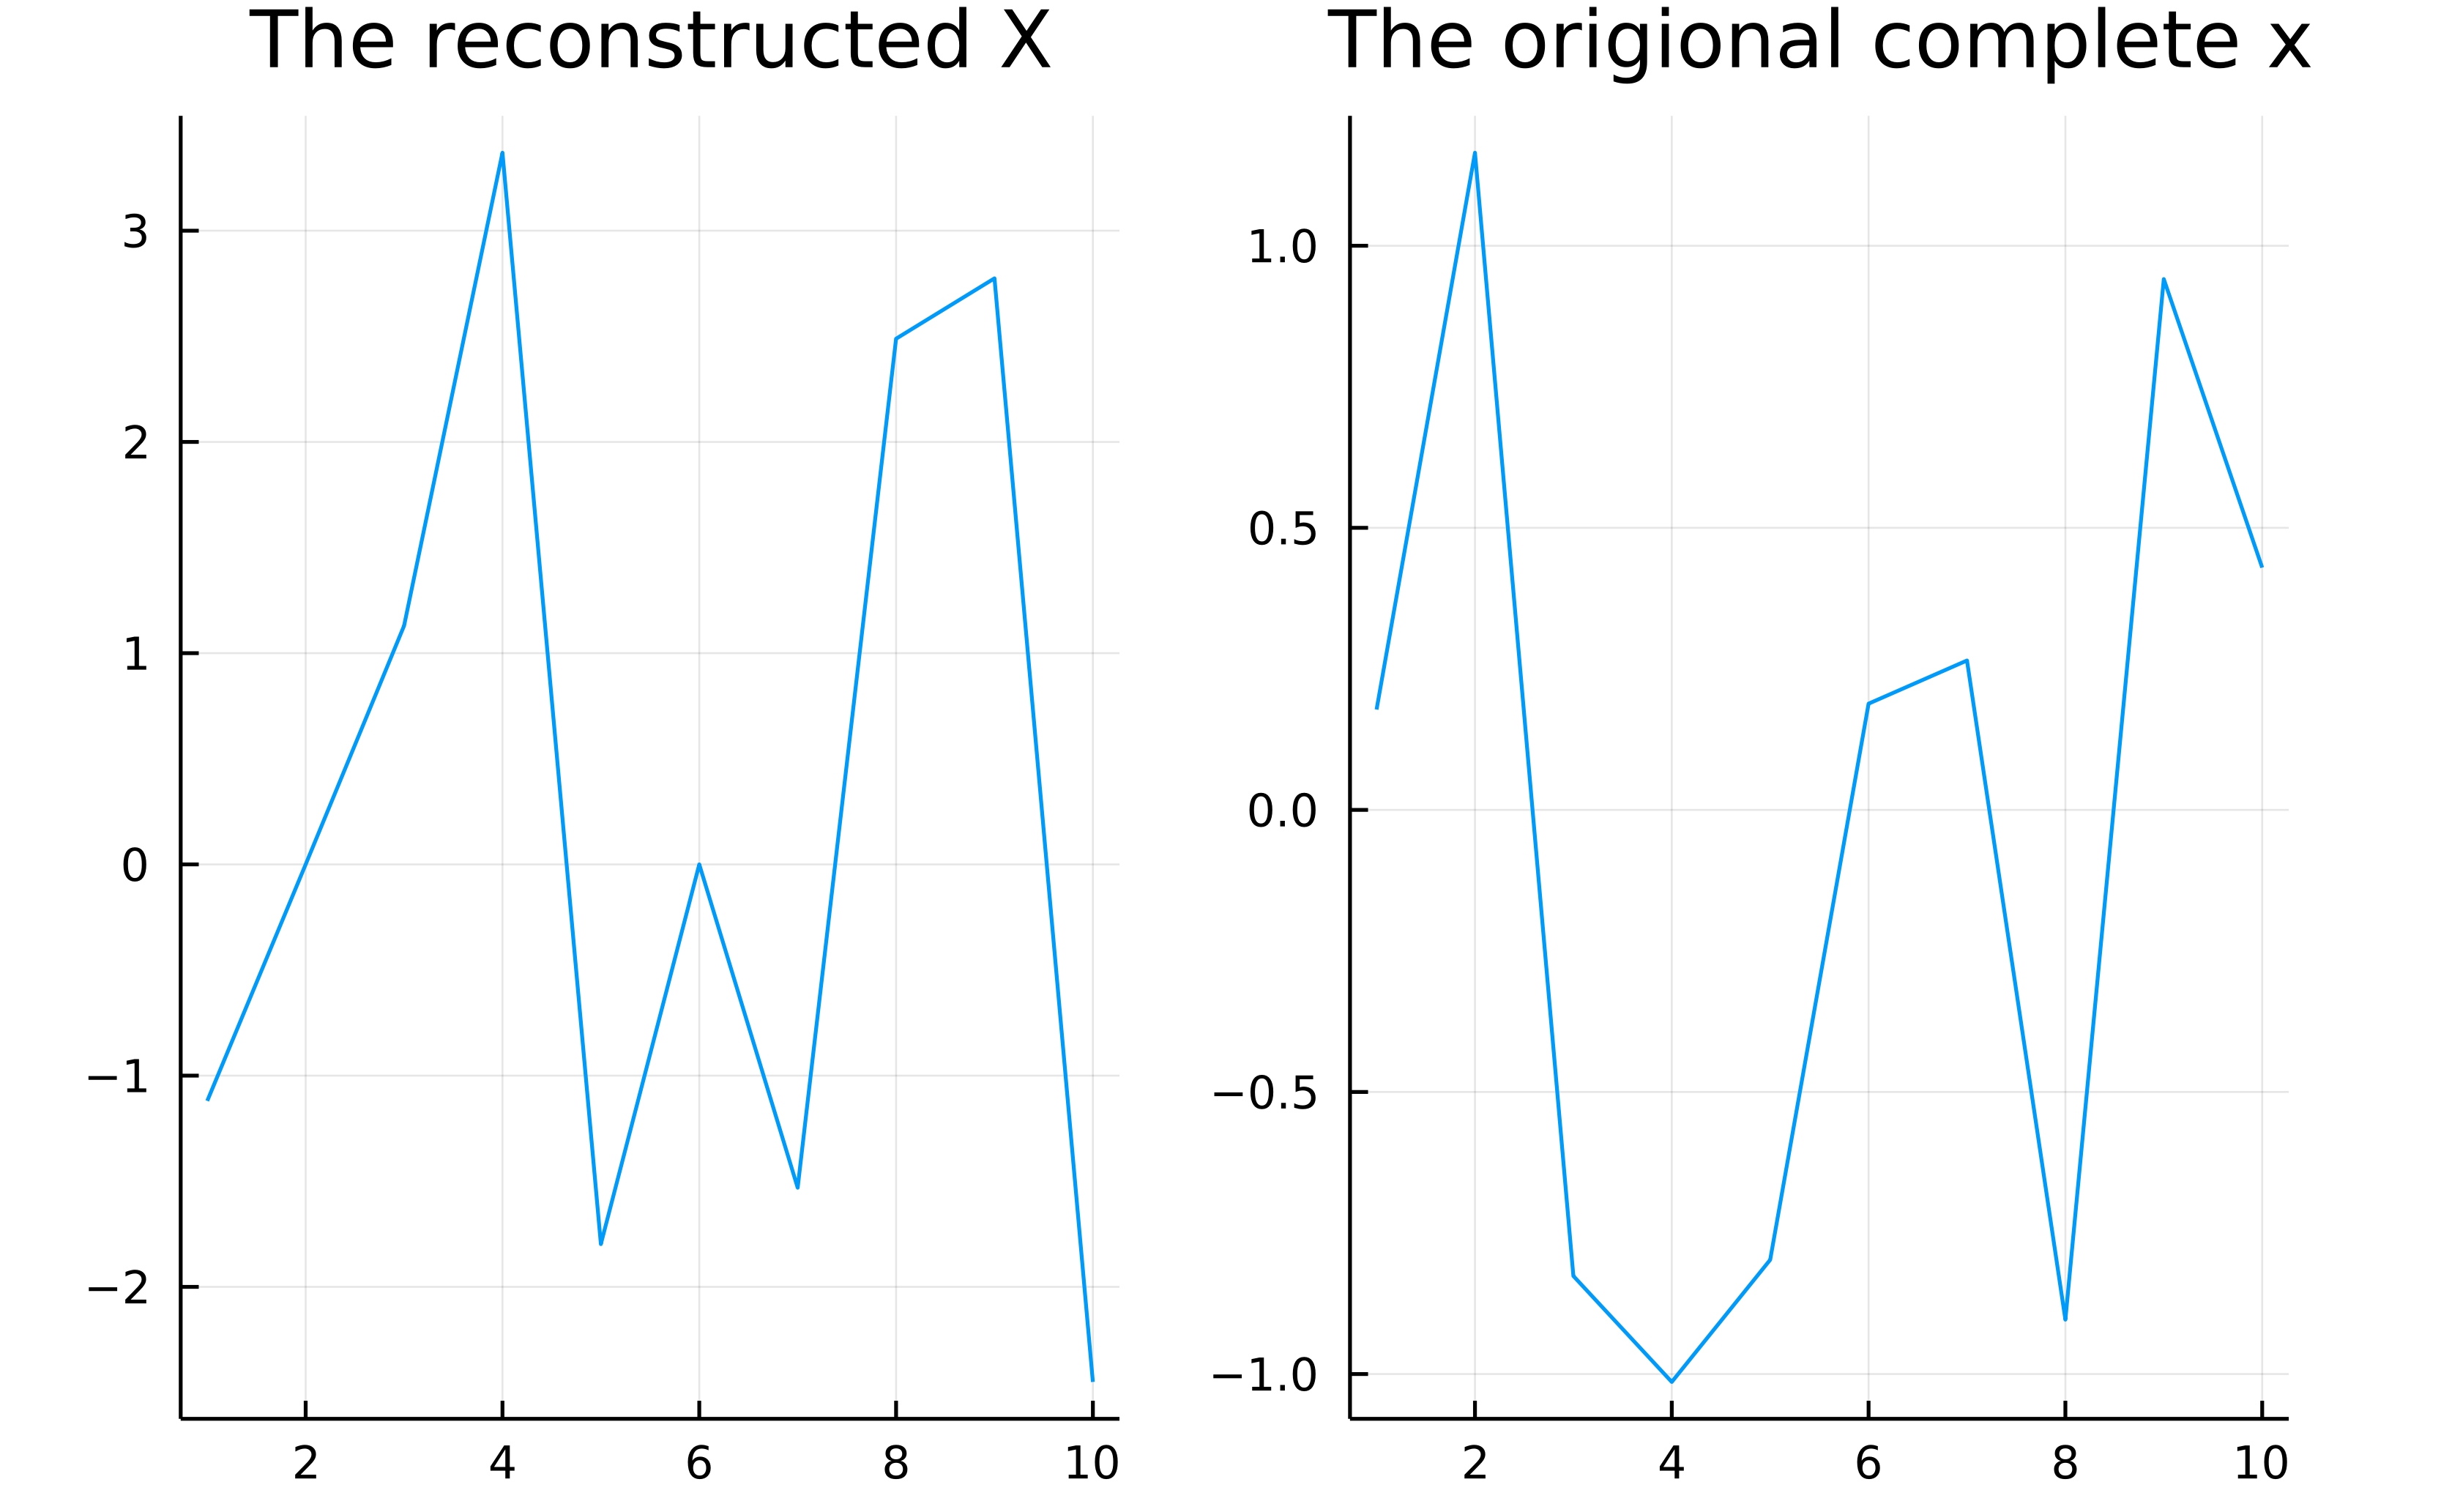 | 3,334 × 2,065 (247 KB) | Molokaicat (talk | contribs) |
You cannot overwrite this file.
File usage
The following page uses this file: