Uncategorized files
Jump to navigation
Jump to search
Showing below up to 100 results in range #51 to #150.
-
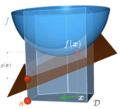
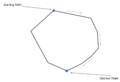
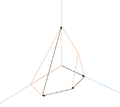
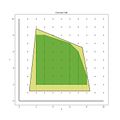 Convex hull.jpg 720 × 720; 44 KB
-
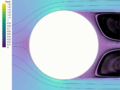
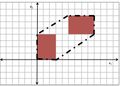 Convex hull relax.jpg 761 × 548; 33 KB
-
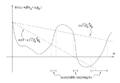
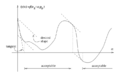 Curvature condition.png 735 × 452; 28 KB
-
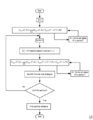 DP.png 520 × 672; 66 KB
-
 Duality numberline .png 966 × 344; 20 KB
-
 ECP.PNG 732 × 386; 58 KB
-
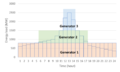
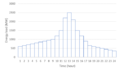 Energy load profile over 24-hour period.png 1,650 × 990; 28 KB
-
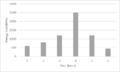 Energy load profile over 6-hour period.png 752 × 451; 7 KB
-
-
 Example.png 1,560 × 792; 76 KB
-
 Example1.png 281 × 29; 3 KB
-
 Example10.png 90 × 24; 1 KB
-
 Example11.png 74 × 19; 1 KB
-
 Example12.png 473 × 330; 25 KB
-
 Example2.png 736 × 539; 38 KB
-
 Example2 2.png 633 × 455; 52 KB
-
 Example2 so.png 209 × 36; 3 KB
-
 Example3.png 1,003 × 457; 77 KB
-
 Example3 so.png 140 × 30; 2 KB
-
 Example4.png 1,685 × 511; 111 KB
-
 Example4 so.png 264 × 28; 3 KB
-
 Example5.png 100 × 24; 2 KB
-
 Example6 so.png 55 × 21; 978 bytes
-
 Example7.png 455 × 323; 58 KB
-
 Example8.png 105 × 23; 2 KB
-
 Example9.png 456 × 330; 46 KB
-
 ExampleStep1.png 329 × 252; 7 KB
-
 Example Membership Function.png 231 × 75; 3 KB
-
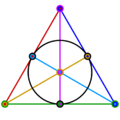 Fano plane with colored lines.svg.png 768 × 768; 51 KB
-
 Feasible unit combinations.png 936 × 357; 9 KB
-
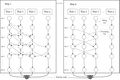 Fig. 8. .jpg 2,937 × 1,955; 348 KB
-
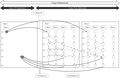 Fig. 9..jpg 2,913 × 1,900; 309 KB
-
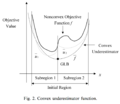 Fig02 KL.png 1,142 × 992; 122 KB
-
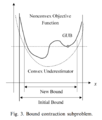 Fig03 KL.png 962 × 1,134; 108 KB
-
 Fig04 KL.png 1,012 × 766; 78 KB
-
 Fig05 KL.png 1,212 × 892; 130 KB
-
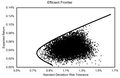
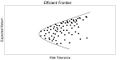 Figure 1- Efficient Frontier Graph.jpg 1,153 × 573; 48 KB
-
-
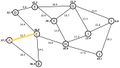
 Figure Representative of Mapped Locations.png 1,216 × 685; 108 KB
-
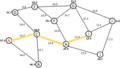
 Figure Showing Map, Highlighting the Chosen Path from Node A.png 1,220 × 689; 122 KB
-
 Final wire length.jpg 642 × 234; 34 KB
-
 Flowchart01 KL.png 1,064 × 784; 128 KB
-
 Four Acquistion functions.jpg 4,200 × 2,945; 425 KB
-
 Fourthandgoal.jpg 540 × 333; 141 KB
-
 Frame 134 delay-0.1s.gif 480 × 360; 65 KB
-
 Frank-Wolfe algorithm step size.png 810 × 734; 553 KB
-
 From a circle to an airfoil via aerodynamic design optimizationfin.png 960 × 720; 155 KB
-
 Frontier.jpg 953 × 618; 73 KB
-
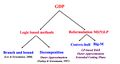 GDP Intro.jpg 741 × 397; 35 KB
-
 GDP numeric example 1.png 926 × 410; 59 KB
-
 GDP numeric example 2.png 1,428 × 320; 50 KB
-
 GDP numeric example 3.png 1,128 × 860; 91 KB
-
 GDP numeric example 4.png 1,234 × 1,360; 180 KB
-
 GDP numeric example 5.png 1,230 × 780; 85 KB
-
 Gambling jpg.jpg 1,035 × 589; 82 KB
-
 Game theory example.png 1,458 × 828; 89 KB
-
 Game theory math.png 1,458 × 848; 110 KB
-
 Generator schedule on load profile.png 1,650 × 990; 55 KB
-
 Geometric Illustration of LP problem.png 2,605 × 1,790; 87 KB
-
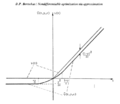
 Goldstein.png 727 × 500; 33 KB
-
 Google Deepmind.jpg 640 × 353; 14 KB
-
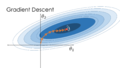 Gradient Descent Visualization.png 1,920 × 1,080; 195 KB
-
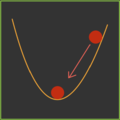 Gradient descent convex.png 598 × 600; 53 KB
-
 Gradient descent momentum.png 580 × 222; 66 KB
-
 Gradient descent nonconvex.png 602 × 600; 56 KB
-
 Hnet.com-image-2.png 1,478 × 1,104; 364 KB
-
 Hnet.com-image.png 1,200 × 896; 242 KB
-
 Hyperparameter optiomizatin.jpg 633 × 198; 30 KB
-
 Image.png 393 × 57; 3 KB
-
 Image2.png 803 × 685; 67 KB
-
 Image45.png 378 × 162; 11 KB
-
 Image can t write h.png 373 × 28; 2 KB
-
 Image line1.png 507 × 35; 3 KB
-
 Image of equations.png 633 × 238; 9 KB
-
 Image of updated estimators and envelopes.png 1,362 × 582; 54 KB
-
 Image over-estimator and under-estimator.png 1,167 × 527; 28 KB
-
 Imagen2.jpg 365 × 274; 17 KB
-
 ImplicitDescent Definition.png 400 × 92; 4 KB
-
 ImplicitSubproblem Definition.png 516 × 64; 4 KB
-
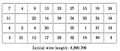 Initial wire length.jpg 651 × 275; 37 KB
-
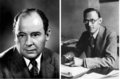 JohnOskar.png 604 × 396; 197 KB
-
 Kinkexample.png 434 × 377; 32 KB
-
 Lemke Howson Pivot Walk.png 504 × 449; 16 KB
-
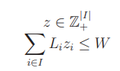 Lizi.png 157 × 93; 3 KB
-
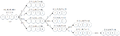
 Longest path.png 1,578 × 757; 109 KB
-
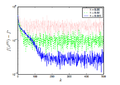
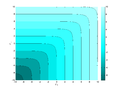 Lse plot.png 1,200 × 901; 12 KB
-
 Lshape.png 1,458 × 1,064; 55 KB
-
 MINLP Branch-and-Bound.jpg 596 × 608; 32 KB
-
 MINLP Illustration.jpg 648 × 687; 34 KB
-
 Map Highlighting Chosen Path from Node A through Node H.jpg 1,327 × 751; 83 KB
-
 Map Highlighting Chosen Path from Node A through Node I.jpg 1,341 × 745; 84 KB
-
 Map Highlighting Chosen Path from Node A to Node C.jpg 1,337 × 758; 83 KB
-
 Map Highlighting Path Through Node I.png 1,231 × 697; 142 KB
-
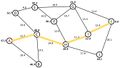
 Map Highlighting Path from Node A through Nodes C and H.png 1,217 × 688; 131 KB
-
 Map Highlighting Shortest Path from Node A through Node K.jpg 1,339 × 759; 85 KB
-
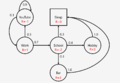 Markov Decision Process Example.png 951 × 660; 38 KB
-
 Markov Decision Process Example 2.png 1,103 × 655; 36 KB
-
 Matt2.jpg 245 × 181; 11 KB
-
 Matt3.jpg 237 × 178; 11 KB
-
 Matt4.png 108 × 56; 8 KB


.png)


