Uncategorized files
Jump to navigation
Jump to search
Showing below up to 50 results in range #151 to #200.
-
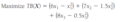 Maximization.png 580 × 106; 16 KB
-
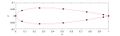
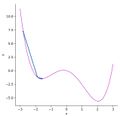
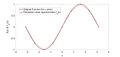
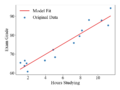 Model fit .png 800 × 600; 42 KB
-
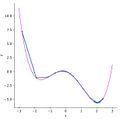 Momentum.jpg 615 × 609; 27 KB
-
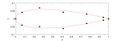
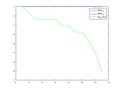 Muvariation.jpg 560 × 420; 13 KB
-
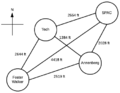 NU TSP.png 431 × 334; 13 KB
-
 Naca0012-1.jpg 1,120 × 340; 24 KB
-
 Naca0012-2.jpg 1,120 × 384; 24 KB
-
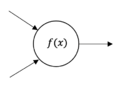 Neuron.png 462 × 334; 44 KB
-
 NewAlgo.jpg 1,324 × 480; 90 KB
-
 NoMomentum.jpg 634 × 612; 27 KB
-
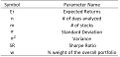 Nomenclature.jpg 961 × 460; 61 KB
-
 Nonsmoothcostfunction.jpg 601 × 442; 36 KB
-
 Normally Distributed.jpg 488 × 90; 14 KB
-
 Number Line X Less Than C.png 1,168 × 136; 6 KB
-
 Number Line for X Greater Than C.png 1,170 × 130; 6 KB
-
 Numerical example.jpg 1,920 × 912; 79 KB
-
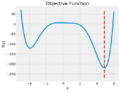 ObjectiveFunction.png 524 × 401; 21 KB
-
 Objective Function Descripion.jpg 764 × 554; 57 KB
-
 Opti wiki.jpg 997 × 401; 49 KB
-
 OptimalSolution.jpg 1,120 × 840; 54 KB
-
 OptimalSolution2.jpg 1,120 × 840; 63 KB
-
 Optimal path.png 707 × 704; 604 KB
-
 Optimization trajectory of the example.jpg 1,988 × 1,105; 93 KB
-
 Optimized unit combinations.png 936 × 326; 11 KB
-
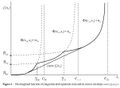
 Overestimator and underestimator diagram 1.png 1,169 × 562; 29 KB
-
 P1.jpg 821 × 161; 28 KB
-
 P2.jpg 821 × 162; 31 KB
-
 P3.jpg 821 × 162; 28 KB
-
 P4.jpg 820 × 163; 28 KB
-
 P5.jpg 821 × 159; 27 KB
-
 Page rewrite.png 1,116 × 733; 71 KB
-
 Peese-logo.jpg 134 × 135; 6 KB
-
 Perfect maze to test A*.gif 759 × 820; 227 KB
-
 Phase 1.png 627 × 227; 43 KB
-
 Phase 2.png 597 × 222; 38 KB
-
 Phase 3.png 662 × 247; 48 KB
-
 Pic8.jpg 666 × 434; 56 KB
-
 Pic9.jpg 667 × 444; 59 KB
-
 Picture1.png 936 × 424; 108 KB
-
 Picture2.png 540 × 274; 40 KB
-
 Picture3.png 300 × 96; 9 KB
-
 Picture4.png 408 × 266; 31 KB
-
 Pong.jpg 460 × 276; 3 KB
-
 PressureContour-1.png 936 × 510; 44 KB
-
 PressureContours-5.png 936 × 510; 45 KB
-
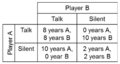 Prisoner's Dilemma.png 939 × 500; 94 KB
-
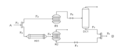 Process network example.png 1,106 × 440; 44 KB
-
 Pscost.png 291 × 41; 2 KB
-
 PseudoCode tau.jpg 1,521 × 488; 83 KB
-
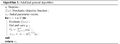
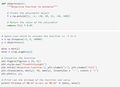
 Pseudocode.png 815 × 437; 68 KB


